Frontend and visual analytics
Pulse Analytics
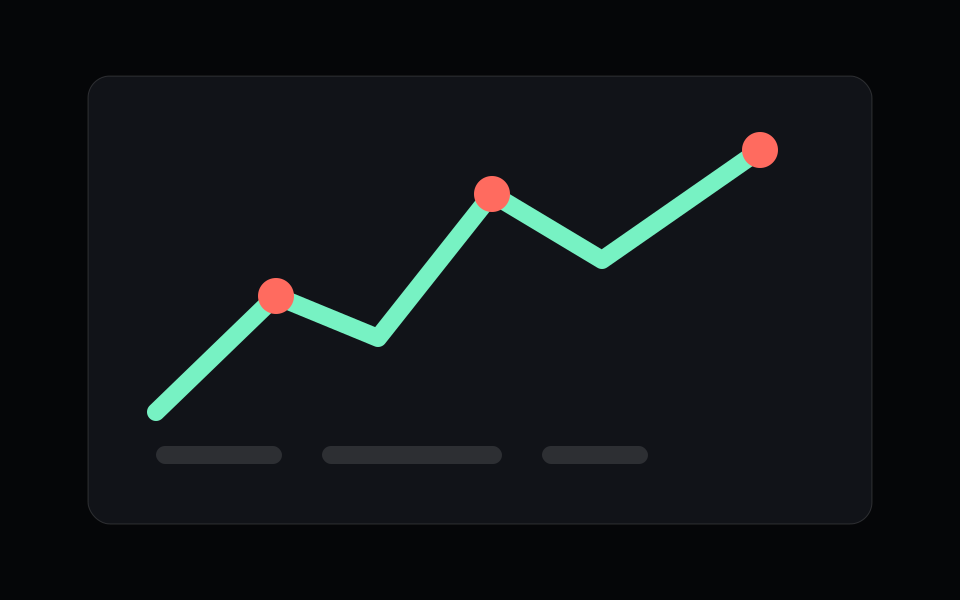
A product dashboard with actionable metrics, cohort segmentation and decision-focused visualizations.
Role
Frontend and visual analytics
Technologies
3 in the solution
Status
Published case
01Product overview
What the product solves.
An analytics layer that turns product events into a clear reading of usage, retention and opportunities without burying people in disconnected charts.
Project stack
 React
 PostgresGSAGSAP
02Gallery
Product screens and details.
Product image
01 screen03Features
What was built.
- 01Cohorts
- 02Product metrics
- 03Responsive visualizations
04Impact
The value delivered.
- 01Faster decisions
- 02Clear retention signals
- 03Presentation-ready dashboard